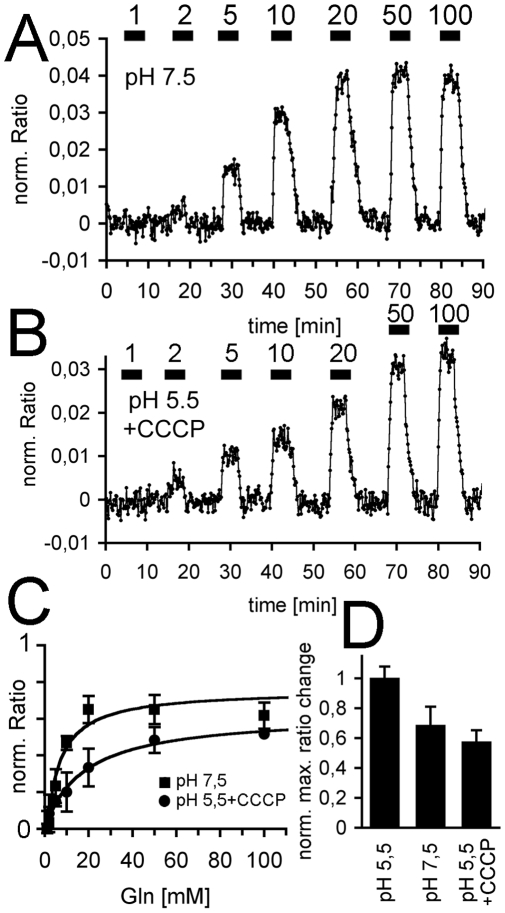
Figure 3. Similar Gln transport at pH 7.5 and partial reduction by a protonophore.
(A) Fluorescence changes that correspond to an influx of Gln at pH 7.5. Superfusion by Gln (in mM) is indicated by the black bars. (B) Fluorescence changes in the presence of the protonophore CCCP (100 µM). Gln is given at times marked with black bars. Numbers indicate Glutamine concentrations in mM. (C) Concentration dependence of the fluorescence. Half maximal ratio change was Kd app = 8.2 mM (n = 2) at pH 7.5 (closed squares) and Kd app = 17.9 at pH 5.5 in the presence of CCCP (100 µM, n = 3, closed circles). (D) Maximal ratio changes at pH 7.5 and pH 5.5 with CCCP relative to those at pH 5.5.

