
Figure 6.
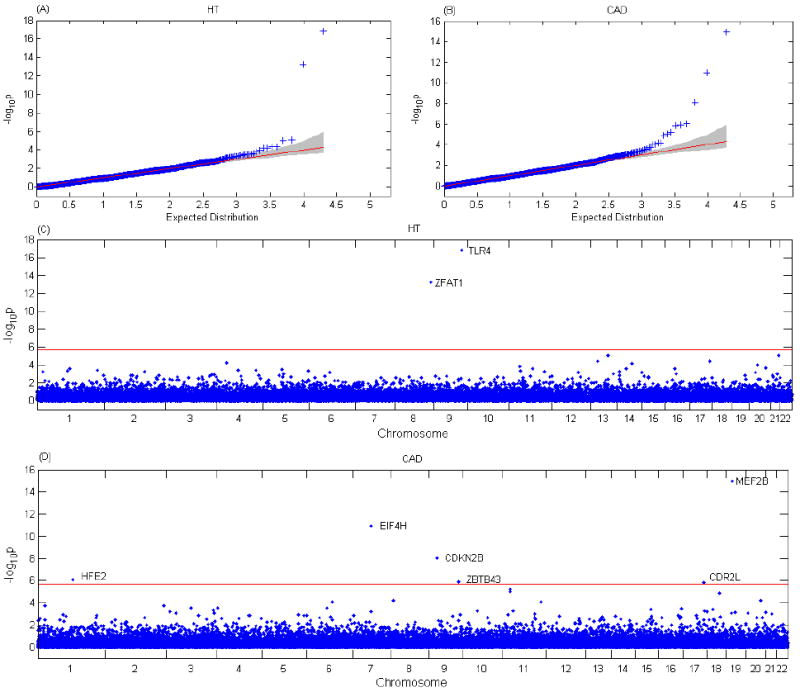
Association results of HT and CAD in the WTCCC data. (A) Q-Q plot of −log10(P value) for the association test between HT and genes. The shaded region is the 95% confidence band. (B) Q-Q plot of −log10(P value) for the association test between CAD and genes. (C) Genome-wide −log10(P value) according to the chromosomal positions of genes in the association test for HT. The red horizontal line indicates a P value of 2.02×10⁻⁶. Two genes with −log10(P value) above the red line are identified. (D) Genome-wide −log10(P value) according to the chromosomal positions of genes in the association test for CAD. The red horizontal line indicates a P value of 2.09×10⁻⁶. Six genes with −log10(P value) above the red line are identified.