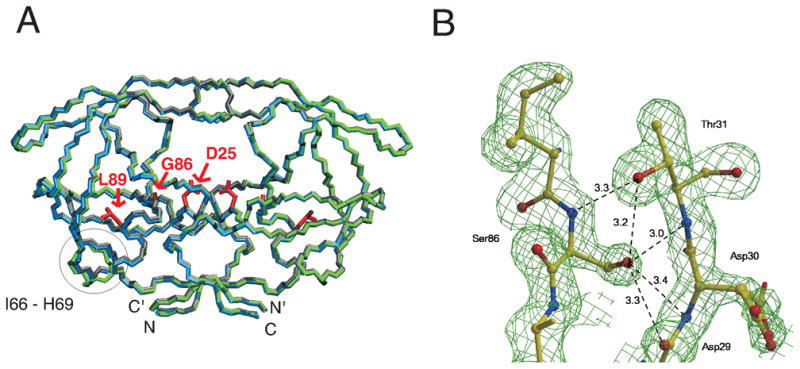
Figure 4.

(A) Comparison of backbone traces of the crystal structures of PR (PDB 2IEN 40, gray with atoms colored by type), PRG86A (blue), and PRG86S (green) in complexes with DRV and (B) Electron density map for region around S86 in crystal structure of PRG86S/DRV. In (A), side chains of residue 25, 86, and 89 are shown in red, and a circle indicates a region (residues 66 to 69) that exhibits the largest Cα rmsd for mutants and PR. In (B), the map is contoured at a level of 2.0 σ, showing side chain conformation of S86 clearly. The hydrogen bond interactions of S86 are indicated by broken lines with distances in Å.
