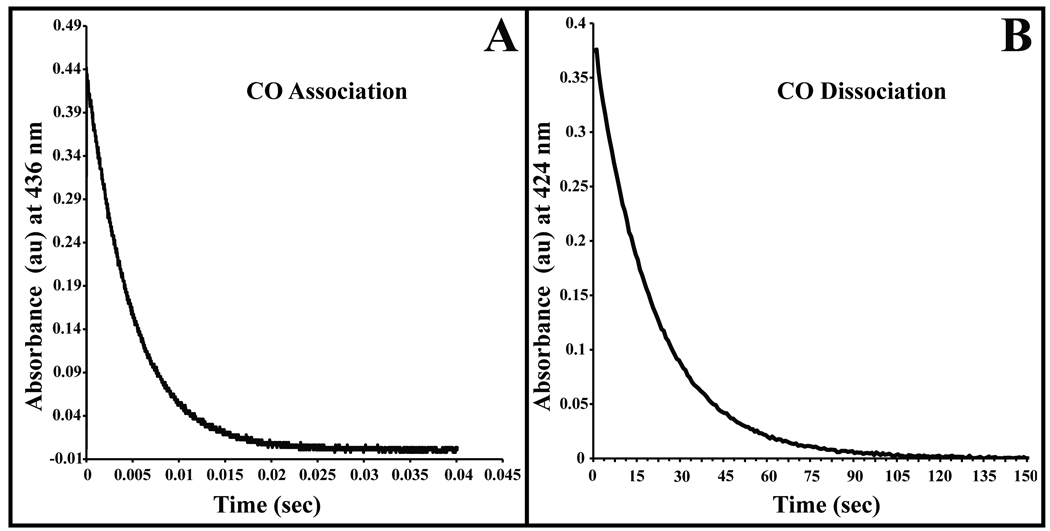
Figure 3.
Time courses for CO association and dissociation. A. Absorbance trace for bimolecular CO rebinding measured at 436 nm after flash photolysis of the Fe-CO complex. The CO concentration for this trace was 1 atmosphere (1000 µM), and the protein concentration was approximately 100 µM. For all CO association and dissociation experiments nitrobindin was in 100 mM potassium phosphate buffer at pH 7 containing EDTA (1 mM) at 20 °C. The overall association rate (k’CO) was computed as the slope of a linear fit to a plot of kobs versus the CO concentration. B. Measurement of the CO dissociation constant by stopped-flow spectrophotometry. CO–nitrobindin was mixed with 100 mM potassium phosphate buffer at pH 7 containing EDTA (1 mM), and 1 atmosphere (2000 µM) of NO at 20 °C. The displacement of the CO–nitrobindin complex was measured by monitoring the absorbance decrease at 424 nm.

