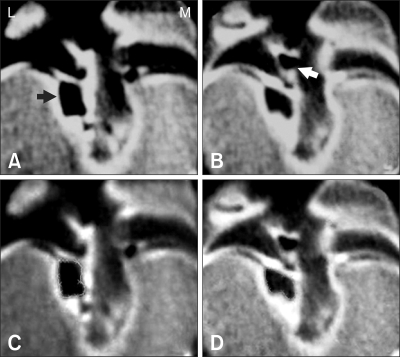
Fig. 4.
Comparison of the pre-operative conventional view (A) and tracing view (C) with the post-operative conventional view (B) and tracing view (D). The transverse area of the cranial cruciate ligament image (black arrow) was decreased by 25% on the post-operative image. The small gas artifact (white arrow) was considered a normal finding. L: lateral, M: medial.

