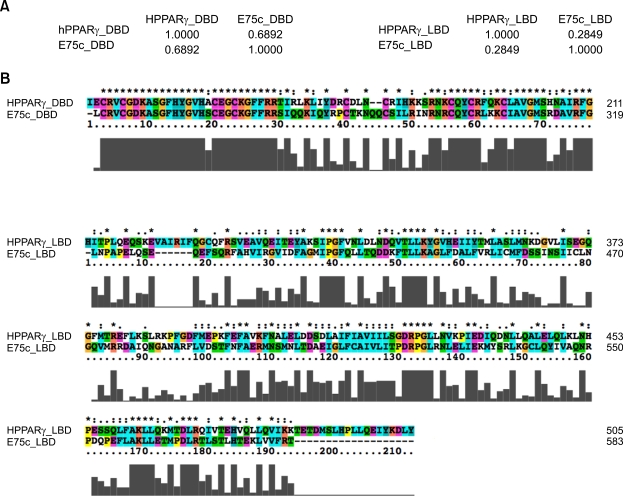
Figure 1.
Comparison of protein sequences between human PPARγ and the fly ecdysone-induced protein E75 isoform C (E75c). The two sequences were aligned by ClustalX v2.0.10 with the protein weight matrix, Gonnet series, and then the alignments and the sequence identities were analyzed and calculated by Pfaat v2.0 (Pfizer Global Research and Development) (Caffrey et al., 2007). DBD: PPARγ 137-211 aa, E75c 243-319 aa. LBD: PPARγ 237-504 aa, E75c 396-583 aa. (A) Sequence identity between characteristic domains of human PPARγ and fly E75c. The DNA-binding domains (DBDs) between them display 69% identity but the ligand-binding domains (LBDs) are relatively less conserved (28% in identity). (B) Sequence alignments of DBDs (Top) and LBDs (Bottom three) between PPARγ and E75c. " * " indicates positions that have a single, fully conserved residue. " : " indicates that one of the following 'strong' groups is fully conserved: STA, NEQK, NHQK, NDEQ, QHRK, MILV, MILF, HY, FYW (single amino acid code). " . " indicates that one of the following 'weaker' groups is fully conserved: CSA, ATV, SAG, STNK, STPA, SGND, SNDEQK, NDEQHK, NEQHRK, FVLIM, HFY (single amino acid code). These are all the positively scoring groups that occured in the Gonnet Pam250 matrix. The strong and weak groups are defined as a strong score > 0.5 and a weak score ≤ 0.5, respectively. Gray bars under the alignments represent the conservation score in an arbitrary unit.

