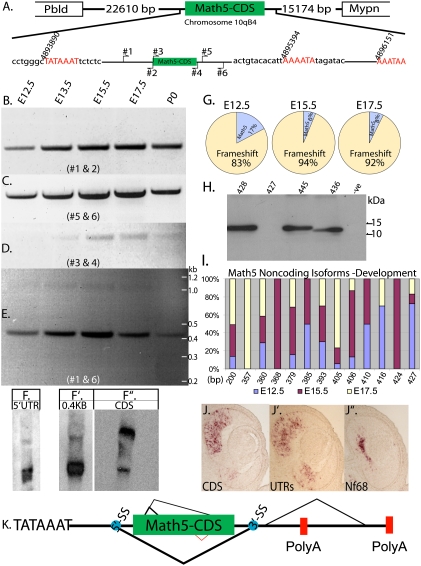
Figure 1.
Math5 is alternatively spliced during development. (A) Schematic representation of the Math5 locus, with the size of the intergenic sequence separating the upstream (Pbld) and downstream (Mypn) genes, respectively. Schematic of the Math5 gene, with the transcription start site (TATA box) and the polyadenylation sites, along with the position of the primers used for RT–PCR analysis. The nucleotide sequence around the transcription start and polyadenylation sites that were identified by RACE are shown along with the nucleotide positions that correspond to the NCBI database. RT–PCR analysis for Math5 across retinal development with primer pairs #1 and #2 (B), #5 and #6 (C), #3 and #4 (D), and #1 and #6 (E). (F) Total RNA blot probed with a 5′UTR probe. (F′) Total RNA blot probed with the 0.4-kb band from E. (F″) Total RNA blot probed with CDS. (G) Quantification of the Math5 CDS fragments amplified from E12.5, E15.5, and E17.5, with primers 3 and 4 showing the percentage of the isoforms in which the CDS frame is maintained and those with a frameshift. (H) Immunoblot analysis of 293T cells transfected with different isoforms of Math5 that have different AS events. The second lane is from cells transfected with the Math5 CDS (427-bp) isoform that could theoretically code for protein if an alternate start codon (GTG) were used. The last lane is untransfected control, which is represented as −ve. (I) Distribution of the Math5 CDS isoforms that result in a frameshift and do not code for protein observed across development. The X-axis shows the size of the isoform and the Y-axis shows the percentage of each isoform. (J–J″) RNA in situ hybridization on serial E12.5 retinal sections probed with DIG-labeled antisense riboprobes made from either the 0.4-kb or 1-kb isoforms of Math5 along with Nf68, which labels differentiating RGCs. (K) An updated schematic of the Math5 gene with all of the AS events, with the thickness of the lines indicating the major to minor splicing events. The blue spots indicate the splice sites that received the highest score for being a spice site by bioinformatic analysis (Supplemental Fig. 3).

