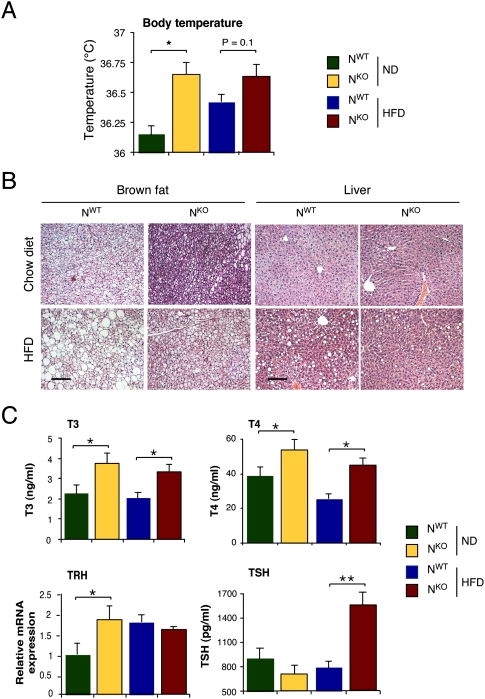
Figure 6.
Activation of the hypothalamic–pituitary–thyroid hormone axis in NKO mice. (A) The body temperature of chow-fed (ND) and HFD-fed NKO and NWT mice are presented (mean ± SD; n = 8). Statistically significant differences between NKO and NWT mice are indicated ([*] P < 0.05). (B) Sections prepared from intrascapular brown fat and liver of chow-fed (ND) and HFD-fed NKO and NWT mice were stained with hematoxylin and eosin. Bar, 100 μm. (C) The concentration of T3, T4, and TSH in the blood of chow-fed (ND) and HFD-fed NKO and NWT mice was measured by ELISA (mean ± SD, n = 10). The amount of Trh mRNA in the hypothalamus was measured by quantitative RT–PCR analysis and was normalized to the amount of Gapdh mRNA measured in each sample (mean ± SD; n = 6∼7). Statistically significant differences between NKO and NWT mice are indicated ([*] P < 0.05; [**] P < 0.01).

