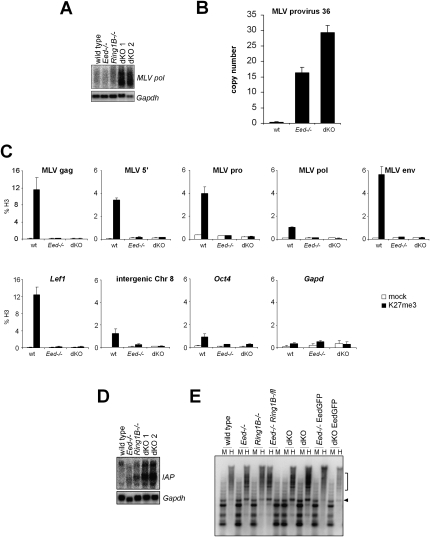
Figure 6.
Redundant repression of endogenous retroviruses by PRC1 and PRC2. (A) Northern analysis showing derepression of endogenous MLV retroelements in dKO ES cells. Gapdh was used as a loading control. (B) Quantitative PCR analysis showing an increase in MLV provirus copy number in Polycomb-deficient ES cells. The copy number was quantitated relative to an intergenic genomic sequence using the standard curve method. (C) Directed ChIP showing enrichment of H3K27me3 over MLV elements in ES cells. (Top row) Different regions of the MLV provirus sequence were investigated by quantitative PCR. (Bottom row) Lef1 was used as a positive control, and Oct4, Gapdh, and an intergenic sequence on chromosome 8 were used as negative controls. H3K27me3 signals are diminished in Eed-deficient ES cells demonstrating specificity. (D) Northern analysis showing the derepression of IAP retroviral sequences in dKO ES cells. Gapdh was used as loading control. (E) Restriction analysis with methylation-sensitive HpaII (H) and methylation-resistant MspI (M) and subsequent Southern analysis show loss of DNA methylation on IAP elements in Eed-deficient and dKO ES cells. Size of demethylated bands in HpaII lanes are indicated by the arrowhead and square bracket.

