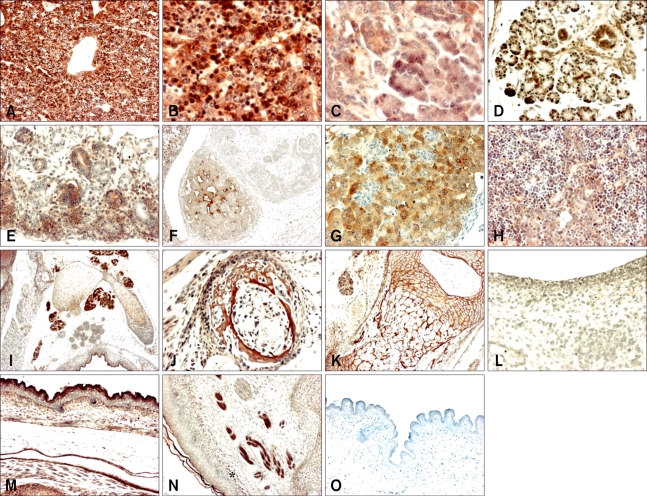
Fig. 3.
Immunohistochemistry using a SOD1 antibody on sagittal sections of developing mouse embryos. (A) Embryonic day (ED) 16.5 liver (×100). (B) ED 16.5 liver (×400). (C) ED 17.5 pancreas (×400). (D) ED 18.5 submandibular gland (×200). (E) ED 16.5 kidney (×200). (F) ED 14.5 adrenal gland (×100). (G) ED 16.5 adrenal gland (×200). (H) ED 17.5 thymus (×200). (I) ED 16.5 lymph node (×40). (J) ED 16.5 bone (×200). (K) ED 18.5 bone (×100). (L) ED 14.5 skin (×200). (M) ED 17.5 skin (×100). (N) ED 18.5 collagen fiber-like tissue (×100). (O) ED 17.5 skin (×100); negative control.

