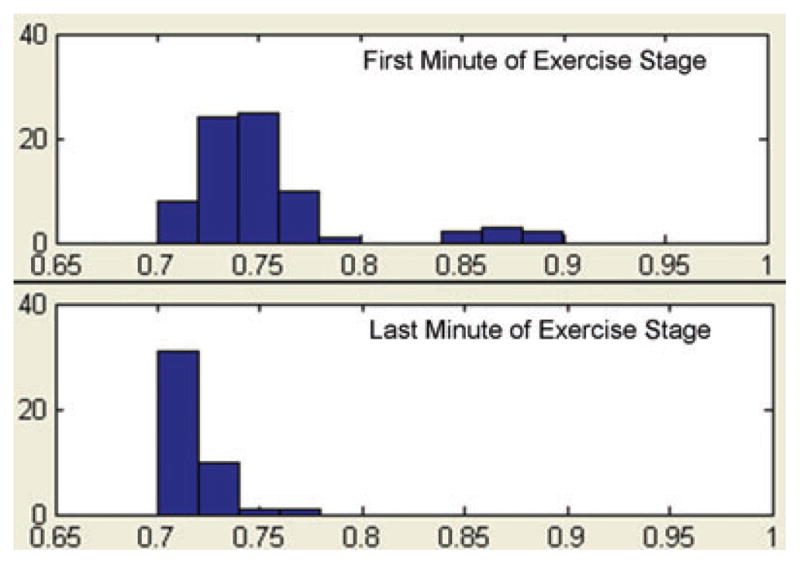
Figure 1.

Histograms of RR intervals during exercise for one subject. All QRST complexes during the first (top panel) and last (bottom panel) minute of a 3-min exercise stage are sorted by RR interval (X-axis represents RR interval in seconds, Y-axis represents # of intervals). Bins are of 20 ms width. In the first minute, there are a few complexes in the three bins spanning 0.84 and 0.9 s, but most occur in the five bins spanning 0.7–0.8 s. During the last minute of the exercise stage, all complexes occur in the four bins spanning 0.7–0.78 ms. For the analysis, identical bins containing at least 10 complexes in both the first and last minute of the stage are selected.
