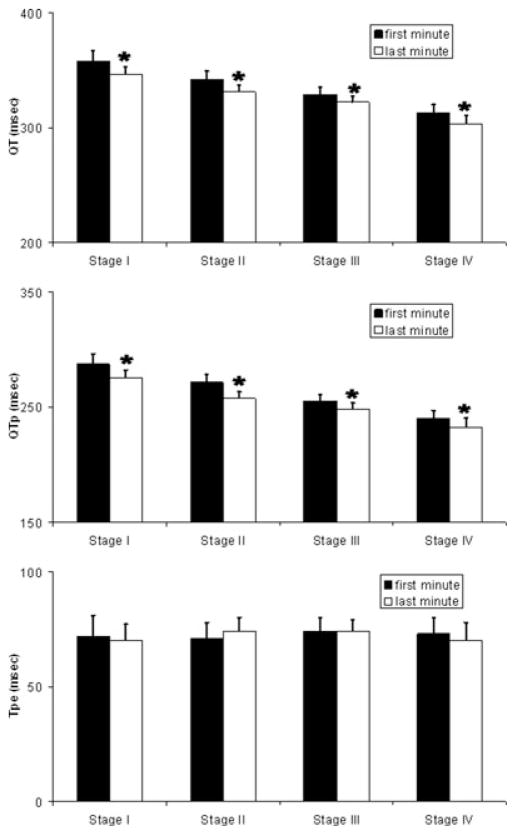
Figure 3.
QT interval, QTp, and Tpe at a fixed heart rate during staged exercise. The absolute QT interval (Panel A), QTp (Panel B), and Tpe (Panel C) are plotted for both the first and last minute of each exercise stage. Within each stage absolute QT and QTp (at the same heart rate) shorten significantly, while the Tpe does not shorten. Y-axis in ms. Data are displayed as mean + 1 SEM. * Indicates P < 0.05.

