
Fig. 4.
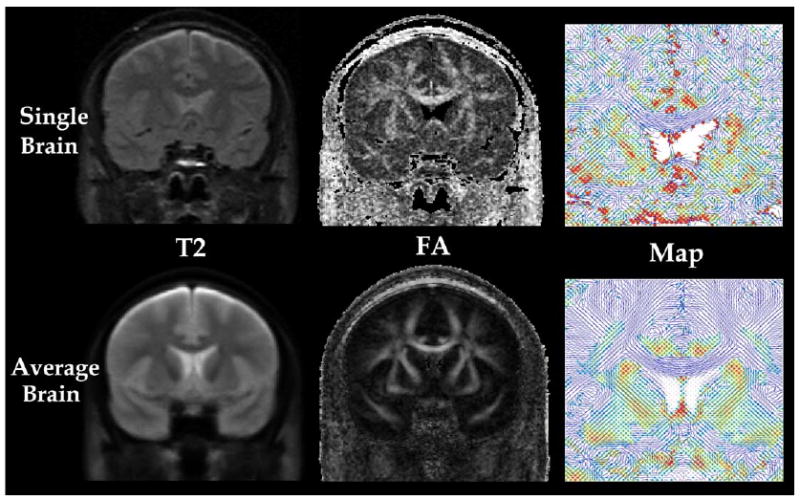
DT-MRI of single brain and a group averaged brain (n = 15). T2-weighted image (T2, first column) and fractional anisotropy image (FA, second column) are displayed for a single brain DT-MRI (top row) and a group average DT-MRI (bottom row). Major eigenvectors of all tensor components (TC, third column) around the corpus callosum of single brain and average brain are also visualized in 2D space by line and colors. The color level indicates the strength of the component of major eigenvector perpendicular to the slice from blue (lowest) to red (highest).