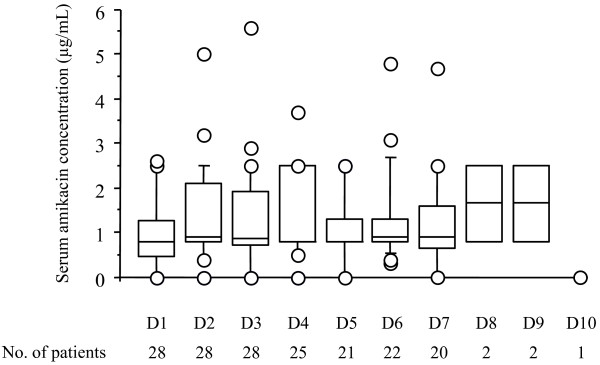
Figure 5.
Serum amikacin trough concentrations during the study from day 1 (D1) to D10 with the corresponding number of patients. T-bars represent the 10th and 90th percentiles; the horizontal line in the box is the median; the lower and upper limits of the box represent the 25th and 75th percentiles, respectively. Circles represent outliers.

