Figure 1.

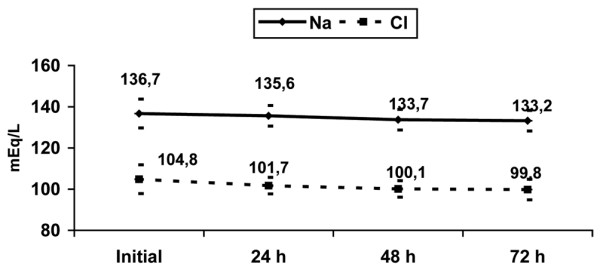
Evolution of sodium and chloride serum levels during the first 72 hours of continuous renal replacement therapy. Mean and standard deviation.

Evolution of sodium and chloride serum levels during the first 72 hours of continuous renal replacement therapy. Mean and standard deviation.