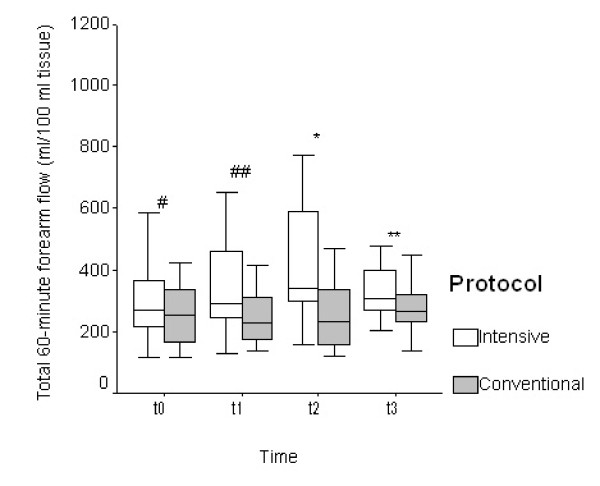
Figure 1.
Total 60-minute blood flow in the forearm at the beginning (t0), after 2 hours (t1), after 24 hours (t2), and after 72 hours (t3) in both groups of patients. Values are shown as medians (horizontal bars inside the box) with the 25th and 75th percentile (upper and lower frame of the box) and the 5th and 95th percentile (bars). # P = 0.28, ## P = 0.05, * P = 0.02, ** P = 0.04.

