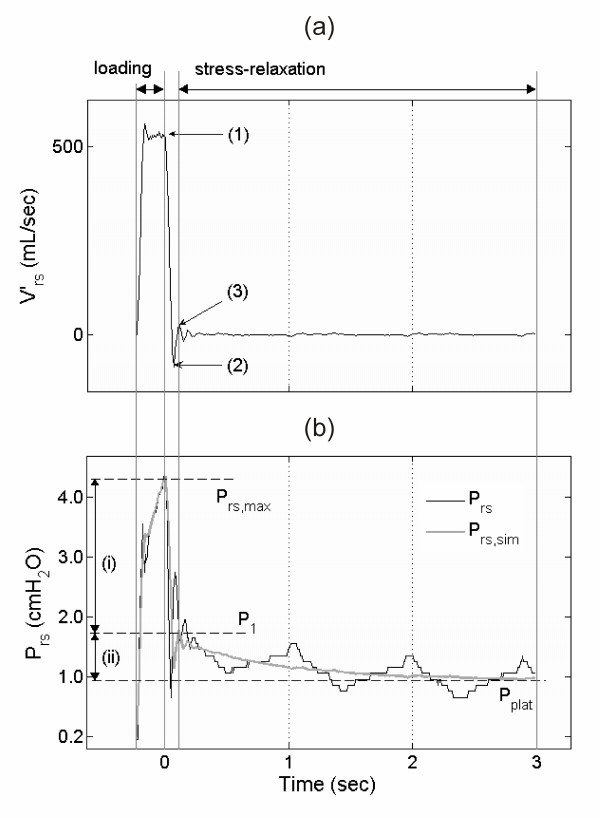
Figure 3.
Flow interruption technique. (a) Respiratory flow  and (b) pressure Prs time-series of one 100 mL volume step including the phases of volume loading (
 >0 mL/sec) and stress relaxation (
 = 0 mL/sec during occlusion interval). (a) Labeled points indicate: (1) start of valve closure, (2) flow falling below zero due to valve characteristics, (3) estimated end of valve closure. The data between (1) and (3) were excluded from the fitting process [see Additional file 1]. (b) Prs with maximum pressure (Prs, max) and approximated plateau pressure (Pplat). Prs, sim depicts the model-simulated respiratory pressure by use of the fitted parameter values. (i) denotes the initial resistive pressure drop (Prs, max down to P1), (ii) denotes the succeeding slow pressure change indicating stress relaxation between level P1 and Pplat.

