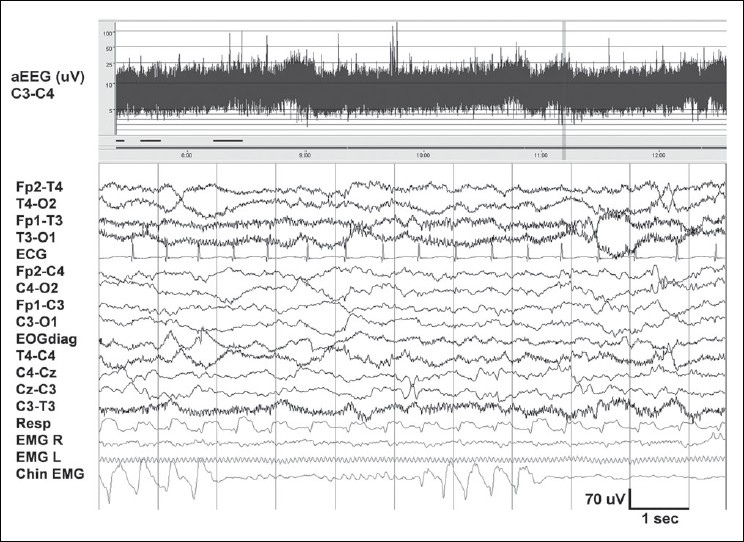
Figure 3.

Awake EEG at term. Shows theta and delta activity with normal voltage (20–70 μV). The faster frequencies (>50 Hz) seen in the temporal channels are due to muscle artifacts. Chin EMG shows rhythmic artifacts produced by sucking. At the top, aEEG trend for a period of five hours. The band width between 5 and 20 μV is normal, and the fluctuations suggest sleep–wake cycling. The 12-second raw EEG sample in the lower part corresponds to the vertical bar on the right of the aEEG
