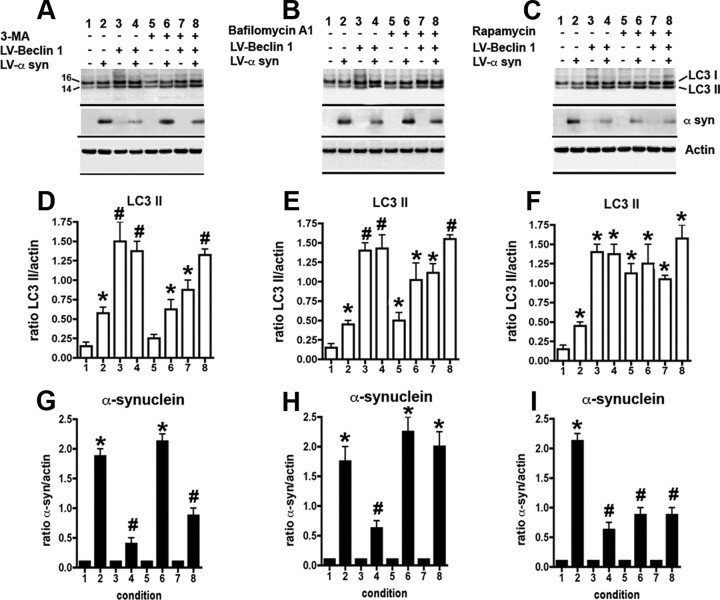
Figure 6.
Immunoblot analysis of the effects of LV-Beclin 1 expression on LC3 II formation and α-syn accumulation in cells treated with modulators of autophagy. B103 neuronal cells were infected with LV-α-syn alone or with LV-Beclin 1 and then were treated with blockers or activators of the autophagy pathway. A–C, Representative Western blots with antibodies against LC3, α-syn, and actin. A–I, Effects of 3-MA (A, D, G), bafilomycin-A1 (B, E, H), or rapamycin (C, F, I). D–F, Levels of LC3 protein were estimated as a ratio of LC3-II to actin levels. G–I, Levels of α-syn immunoreactivity were estimated as a ratio to levels of actin. *Statistical significance compared with uninfected control cultures; #statistical significance compared with untreated LV-α-syn-infected cultures (p < 0.05, 1-way ANOVA, post hoc Fisher test).

