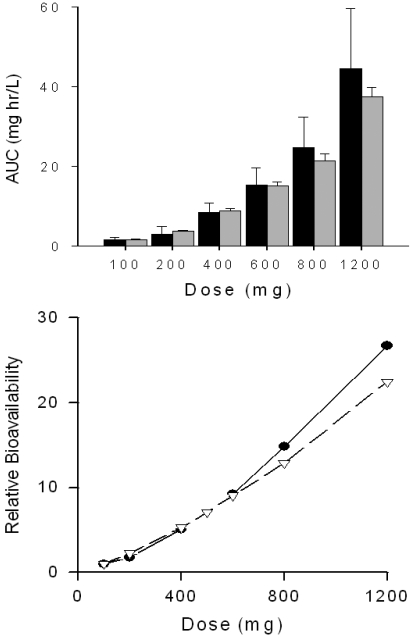
Fig. 2.
Clarithromycin AUC∞ and relative bioavailability after single doses of clarithromycin. Top, predicted ( ) and observed (■) clarithromycin AUC∞ after single doses of clarithromycin. Error bars represent S.E. in 100 simulated subjects (predicted) or in observed subjects (n = 6 for 100 mg of clarithromycin; n = 8 for all other doses) (Chu et al., 1992). Bottom, relative bioavailability of clarithromycin compared with 100 mg oral dosage. ●, observed data; △, predicted values.

