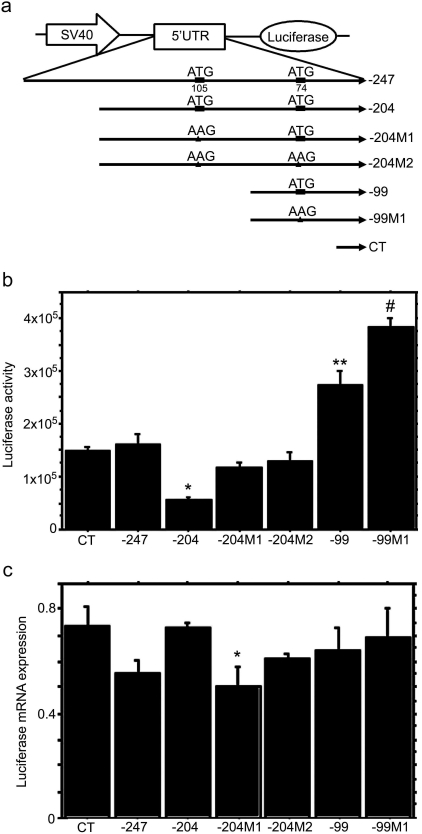
Fig. 2.
Role of the MRP2 5′UTR in the regulation of downstream ORF expression. a, schematic representation of the constructs used for HepG2 cell transfection. −247, full length of MRP2 5′UTR, from −247 to −1 relative to MRP2 start codon ATG; −204, fragment of MRP2 5′UTR from −204 to −1; −204M1, −105 ATG was mutated to AAG in −204; −204 M2, −105 ATG and −74 ATG were mutated to AAG in −204; −99, fragment of MRP2 5′UTR from −99 to −1; −99 M1, −74 ATG was mutated to AAG in −99; CT, the fragment between SV40 promoter and luciferase gene in pGL3 control vector. b, effects of MRP2 5′UTR on luciferase activity in transiently transfected HepG2 cells. Two days after transfection, cells were directly lysed and measured for luciferase activity. CT, −247, −204, −204 M1, −204 M2, −99, and −99 M1 are SV40-5′UTR-luciferase cassettes amplified from corresponding vectors as shown in a. Values are mean ± S.E.M. (n = 3). *, p < 0.05 versus −204 M1 and −204M2; **, p < 0.01 versus CT, −247, −204, −204 M1, and −204 M2; #, p < 0.05 versus −99. c, real-time RT-PCR analysis of luciferase mRNA expression in SV40-5′UTR-Luciferase cassette transfected HepG2 cells. After 2 days of transfection, the cells were harvested for RNA isolation. The luciferase mRNA expression was detected by real time RT-PCR and normalized by its 18S expression. Values are mean ± S.E.M. (n = 3). *, p < 0.05 versus −204.

