Fig. 5.
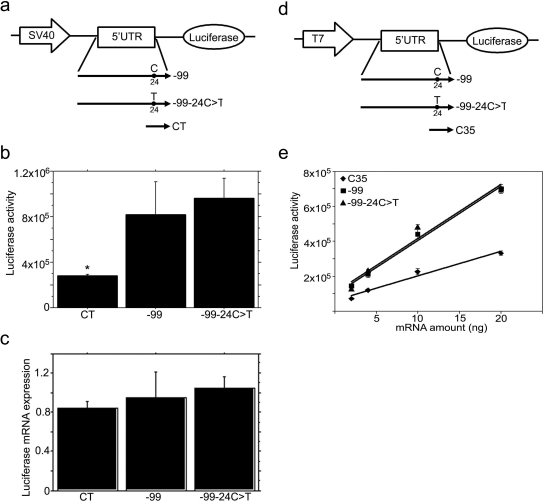
The −24C>T polymorphism in the MRP2 5′UTR does not affect mRNA expression or translation of the downstream luciferase gene. a, schematic representation of the constructs used for HepG2 cell transfection. −99 and CT, the same as described in Fig. 2a; −99–24C>T, the −24C was mutated to T in −99. b, luciferase activity in SV40-5′UTR-luciferase cassette transfected HepG2 cells. After 2 days of transfection, the cells were harvested for measurement of luciferase activity. CT, SV40-5′UTR-luciferase cassette amplified from pGL3 control vector; −99, −99–24C>T are SV40-5′UTR-luciferase cassettes amplified from corresponding vectors as described in a. Values are mean ± S.E.M. (n = 3). *, p < 0.001 versus −99 or −99–24C>T. c, real-time RT-PCR analysis of luciferase mRNA in SV40-5′UTR-Luciferase cassette transfected HepG2 cells. Two days after transfection, RNA was isolated, and luciferase mRNA expression detected by real time RT-PCR and normalized by 18S expression. Values are mean ± S.E.M. (n = 3). d, schematic representation of the constructs used in in vitro translation assays. −99 and −99–24C>T, the same as described in a; C35, the same as described in Fig. 3 a. e, in vitro translation assays of 5′UTR-luciferase transcript. The T7-5′UTR-luciferase cassettes were amplified by PCR from corresponding vectors as described in c; the cassettes were used as templates to synthesize the capped, 5′UTR-fused luciferase transcripts. The 5′UTR-luciferase transcripts (0, 2, 4, 10, or 20 ng of mRNA) were added to rabbit reticulocyte lysate mixture. The lines are the best linear fit of the relationship between luciferase activity and mRNA transcript concentration. The slopes represent translation efficiencies. The statistical significance of the difference between the slopes was tested by GraphPad Prism 4.0.

