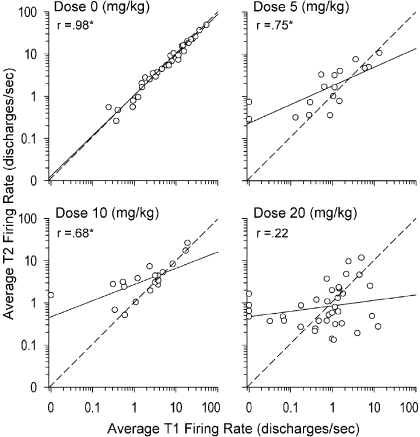
Fig. 3.
Graphic representation of most salient results of the hierarchical linear model (text and Tables 2 and 3). EB estimates derived from HLM (see eqs. 1–3) of the average T2FR and raw average T1FR plotted for each dose of cocaine using scatter plots. Each dot represents one neuron. For ease of interpreting changes across the spectrum of slow- and fast-firing neurons, x- and y-axes (T1FR and T2FR, respectively) were both log10-transformed. Solid line represents OLS regression line for log10-transformed FR. The r values are the correlations (∗p < 0.05) between the log10-transformed average T1FR and T2FR for each dose. Dashed line represents the line of no change. Dots above the dashed line: average T2FR of the neuron increased from its average T1FR; dots below the dashed line: average T2FR of the neuron decreased from its average T1FR. Progressive clockwise rotation of regression lines (solid lines) with increasing dose of cocaine was indicated in HLM by significant between-neuron negative interaction parameters associated with dose · average T1FR (γ04 = −0.0322) and dose2 · average T1FR (γ05 = −0.0045) for within-neuron intercept parameter (β0), i.e., average T2 FR.

