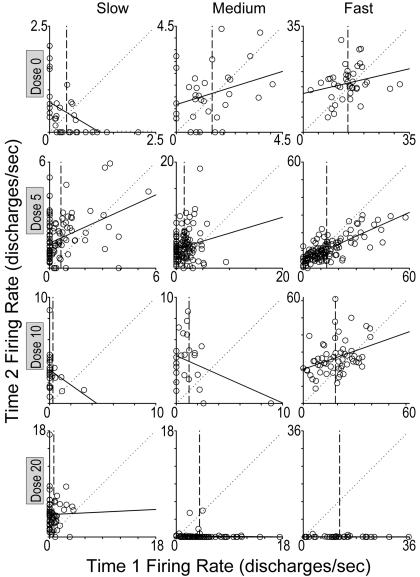
Fig. 5.
Scatter plots regressing T2FR (y-axis) on T1FR (x-axis) of each matched pair of 12 individual neurons. Each graph represents one neuron, and each dot represents one of its matched pairs. Neurons that exhibited average T1FR that were representative of slow-, medium-, or fast-firing neurons are illustrated for each dose of cocaine (milligrams per kilogram) shown at left of each row. Lengths of both axes for each scatter plot were customized to accommodate the T1FR and T2FR for each neuron and set to be equivalent to each other. Solid line, OLS regression line for each neuron, which corresponds to the within-neuron portion of the HLM (see equation 1). Dotted diagonal reference line, line of no change, i.e., regression line that would be expected if the T1FR and T2FR of the neuron's matched pairs maintained perfect stability across T1 and T2. Vertical line corresponds to the average T1FR of the neuron, which was used as the centering point for T1FR in equation 1 of the HLM. Value on y-axis for point of intersection of vertical reference line and regression line corresponds to the value of the centered intercept in equation 1, which is the average T2FR of the neuron.

