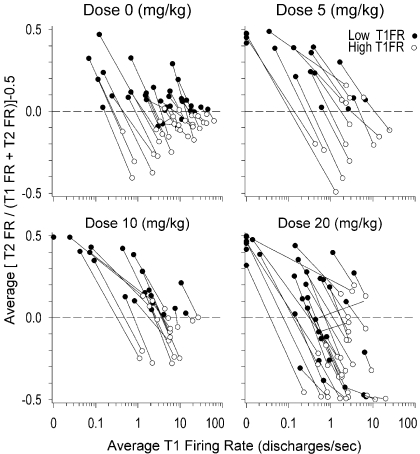
Fig. 7.
Average standardized value of change in FR {average[(T2FR/{T1FR + T2FR}) − 0.5]} for low versus high T1FR matched pairs regressed onto average T1FR for all four doses of cocaine. Solid dots represent average standardized value of change for matched pairs in which T1FR ≤ average T1FR of their respective neuron. Open circles represent the average standardized value of change for matched pairs in which T1FR > average T1FR of their respective neuron. Solid lines connect average standardized values of change of low and high T1FR matched pairs from the same neuron. Note: seven neurons exhibited only a low FR (solid dot) because for them, average T1FR = 0; thus, all their matched pairs were assigned to the low FR category. Dashed horizontal line represents line of no change; y-axis values >0 represent increases above T1FR; y-axis values <0 represent decreases below T1FR.

