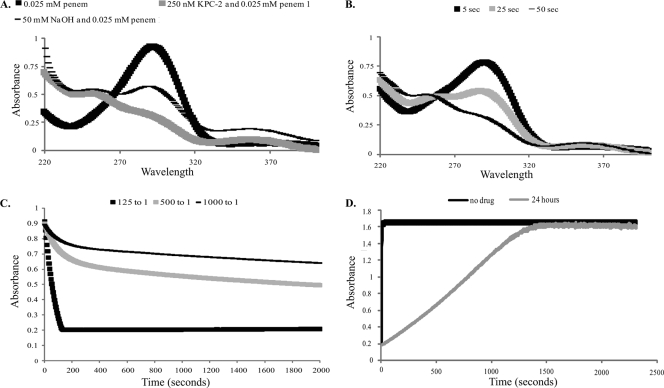
FIG. 2.
(A) UVD spectra for 25 μM penem 1, a mixture of 25 μM penem 1 and 0.25 μM KPC-2, and a mixture of 25 μM penem 1 and 50 mM NaOH after 50 s of incubation. (B) UVD spectra for a mixture of 25 μM penem 1 and 0.25 μM KPC-2 monitored over periods of 5, 25, and 50 s. (C) Penem 1 hydrolysis by KPC-2 monitored at A290 using ratios of 125:1 (25 μM penem 1 and 200 nM KPC-2), 500:1 (25 μM penem 1 and 50 nM KPC-2), and 1,000:1 (25 μM penem 1 and 25 nM KPC-2). (D) Hydrolysis of NCF (100 μM) by 1.0 μM KPC-2 after inhibition by 1.0 mM penem 1 at a 1,000:1 inhibitor-to-enzyme ratio during 24 h of incubation at room temperature compared to hydrolysis by KPC-2 alone.

