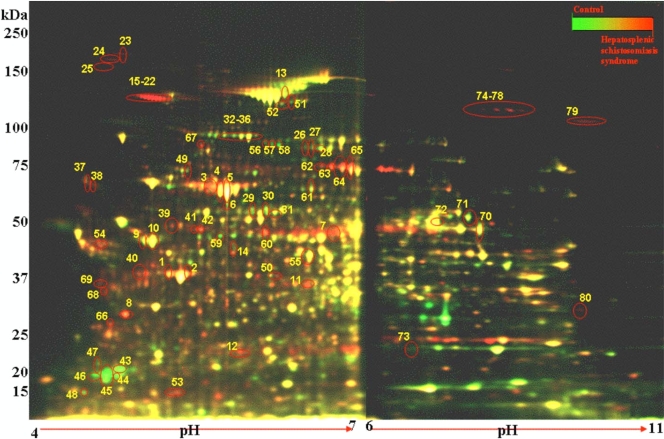
FIG. 1.
Pseudocolor map of total liver proteins from uninfected and HSS mice separated by 2D-DIGE. Liver lysates from control/uninfected liver were labeled with Cy5 (green), lysates from 20-week-infected HSS liver were labeled with Cy3 (red), and a pooled internal standard of liver lysates from all mice in the study (n = 15) was labeled with Cy2 (blue) (not shown). Isoelectric focusing was performed on 7-cm IPG strips (pH 4 to 7 and pH 6 to 11), and proteins were then separated by using SDS-PAGE. The image overlays of Cy5- and Cy3-labeled proteins appear yellow. The numbers correspond to the protein spots in Table 1. Note that the MUP (protein spots 45 to 49) is green, showing higher abundance in control mice, and that collagen (protein spots 16 to 23) is red, showing higher abundance in HSS mice.

