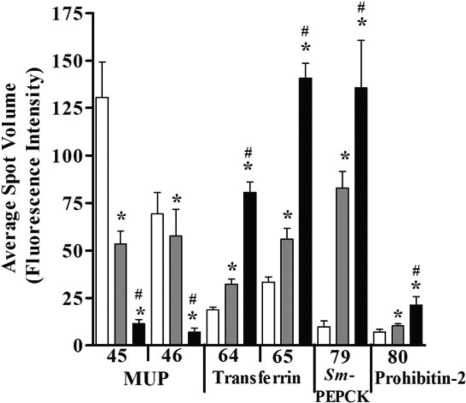
FIG. 3.
The abundances of MUP isoforms, transferrin isoforms, SmPEPCK, and prohibitin 2 are significantly altered in HSS livers. One-way ANOVA for all spots gave a P value of ≤0.01. *, P < 0.05 compared to control; #, P < 0.05 compared to MSS mice by Newman-Keuls multiple-comparison test. The numbers on the x axis correspond to the protein spots in Table 1.

