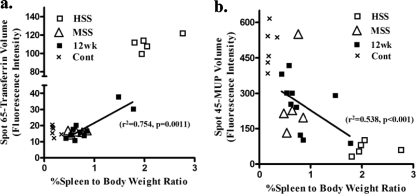
FIG. 6.
Comparison of spot volume fluorescence intensities from liver MUP spot 45 (a) and liver transferrin spot 65 (b) with percent spleen-to-body weight ratios from control and 12-week-infected MSS and HSS mice. Linear regression analysis for 12-week-infected mice (n = 10) gave the following values: r2 of 0.538 and P value of <0.001 for MUP and r2 of 0.754 and P value of 0.0011 for transferrin.

