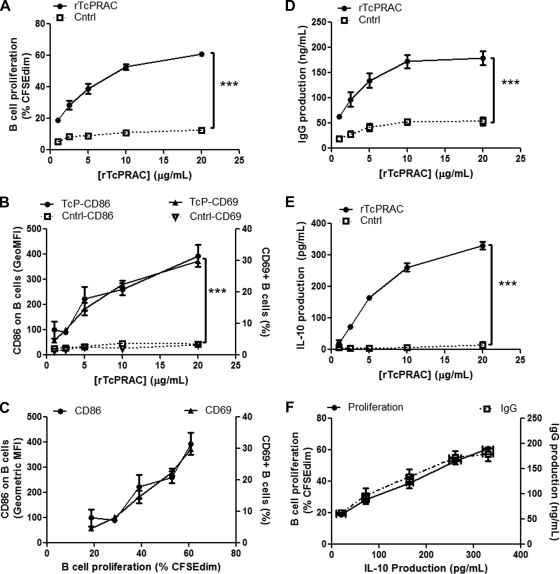
FIG. 2.
rTcPRAC-induced B-cell proliferation, surface activation phenotype, IgG secretion, and IL-10 secretion. BALB/c splenocytes were stimulated for 72 h with rTcPRAC. (A) Increased B-cell proliferation compared to that of controls (P < 0.0001) was dose dependent (P = 0.02; R2 = 0.86; Pearson test). (B) Increased expression of CD69 and CD86 on B cells compared to that on negative controls (P < 0.0001) was dose dependent (P = 0.008 and R2 = 0.93 for CD69 and P = 0.009 and R2 = 0.92 for CD86). (C) CD69 and CD86 expression on B cells correlated with TcPRAC-induced B-cell proliferation (P < 0.001 and R2 = 0.98 for CD69 and P = 0.01 and R2 = 0.90 for CD86). (D) Increased IgG secretion compared to that in controls (P < 0.0001) was dose dependent (P = 0.03; R2 = 0.94; Pearson test). (E) Increased IL-10 production compared to that in controls (P < 0.0001) was dose dependent (P = 0.02; R2 = 0.88). (F) IL-10 production correlated with both B-cell proliferation and IgG production (P = 0.0001 and R2 = 0.996 for B-cell proliferation and P = 0.0032 and R2 = 0.962 for IgG production). Data are presented as means for duplicate or triplicate repeats ± SEM. Two-way ANOVA was used to compare treatment groups, and the Pearson test was used for correlation.

