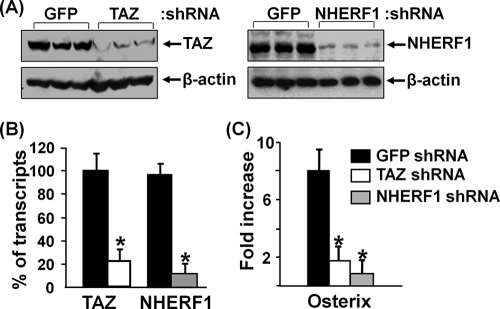
FIG. 8.
Knockdown of TAZ and NHERF1 expression decreases ephrin B1 reverse signaling-mediated osterix expression. BMS cells were infected with lentivirus shRNA and treated with clustered EphB2 for 3 days. (A) TAZ and NHERF1 expression analyzed by Western blotting. (B) TAZ and NHERF1 expression quantified by RT real-time PCR. (C) Osterix expression quantified by RT real-time PCR. Asterisks indicate a significant difference in KO mice compared with WT mice (n = 3, P < 0.01).

