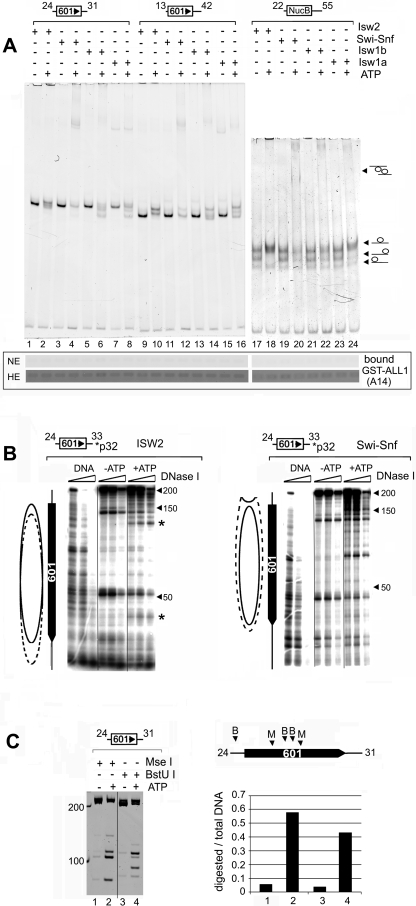
FIG. 3.
The SET domain of ALL1 does not bind remodeled mononucleosomes. (A, top) Analysis of remodeled mononucleosomes by native PAGE. Remodeling assay mixtures (50 μl) contained 1.2 μg of nucleosomes and 2.5 ng of ISWI or 5 ng of Swi-Snf complexes and were incubated at room temperature for 1.5 h. Details can be found in Materials and Methods. One-fifth of the reaction mixture was resolved on native 5% polyacrylamide gels and stained with ethidium bromide. The locations of nucleosomes positioned on the ends and middle of the DNA fragment are indicated on the left. (Bottom) The remainder of each reaction mixture was used in a GST pulldown assay with immobilized GST-ALL1 (A14 in Fig. 1C). The binding of nucleosomes was detected by analyzing nucleosomal DNA content on ethidium bromide-stained agarose gels. Two exposures of the gel are shown, normal exposure (NE) and high exposure (HE). The high exposure revealed the background retention of nucleosomes on the beads to demonstrate the recovery of DNA. This amount is similar to that typically retained on control beads (data not shown). (B) Verification of the remodeling of mononucleosomes by DNase I footprinting. Nucleosomes were assembled onto 32P-end-labeled DNA templates (depicted above each panel) and remodeled by ISW2 (left) or SWI/SNF (right) as described for panel A. Remodeling was terminated by incubating the reaction mixtures with apayrase and digestion with increasing amounts of DNase I. Products were purified and resolved on denaturing gels and visualized by autoradiography. The solid oval indicates the position of the nucleosome in the absence of ATP, while the dotted oval estimates its location after remodeling. The asterisks indicate the two hypersensitive sites shifted toward the unlabled end of the DNA fragment. (C) Restriction endonuclease analysis of SWI/SNF remodeled nucleosomes. Conditions are described in Materials and Methods. The locations of the MseI (M) and BstU I (B) sites on the template are indicated in the schematic diagram on the right. The graph on the right depicts the fraction of DNA cleaved as a ratio of total amount of DNA in each lane. The numbers under the bar graph correspond to the lanes in the gel.

