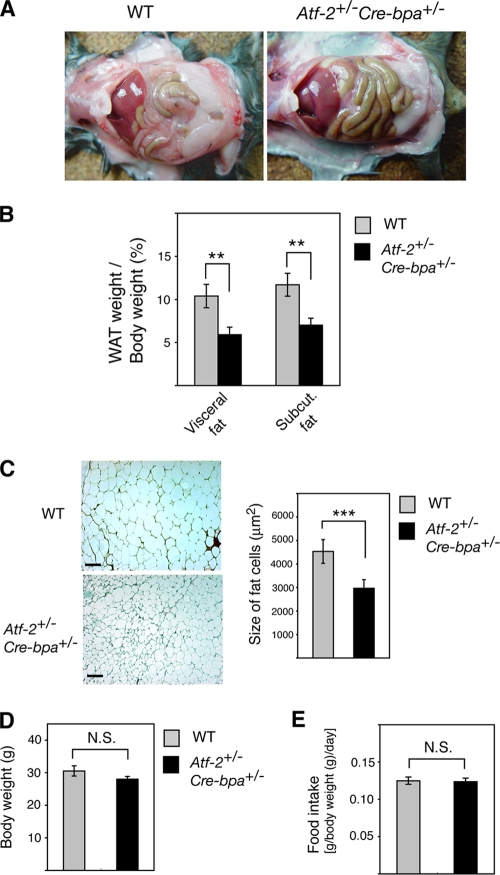
FIG. 1.
Reduction in adipose tissue in Atf-2+/− Cre-bpa+/− mice. (A) Defects in adipose tissue development. Peritoneal cavities of 8-month-old WT and Atf-2+/− Cre-bpa+/− mice are shown. (B) Reduced WAT weight in Atf-2+/− Cre-bpa+/− mice. WAT weight/body weight of 8-month-old WT and Atf-2+/−Cre-bpa+/− mice is shown. Each bar represents the mean ± SEM (n = 4 to 5). **, P < 0.01. (C) Histology of adipose tissue using H&E staining of visceral fat sections (left). Bar, 100 μm. For the graph of the size of fat cells (right), the total numbers of cells examined were 660 to 1,260 from three different mice for each group, and each bar represents the mean ± SEM. ***, P < 0.001. (D) Body weight of 8-month-old WT and Atf-2+/− Cre-bpa+/− mice. Each bar represents the mean ± SEM (n = 4 to 5). (E) Relative food intake during a 3-week period. Each bar represents the mean ± SEM (n = 4 to 5). N.S., no significant difference.

