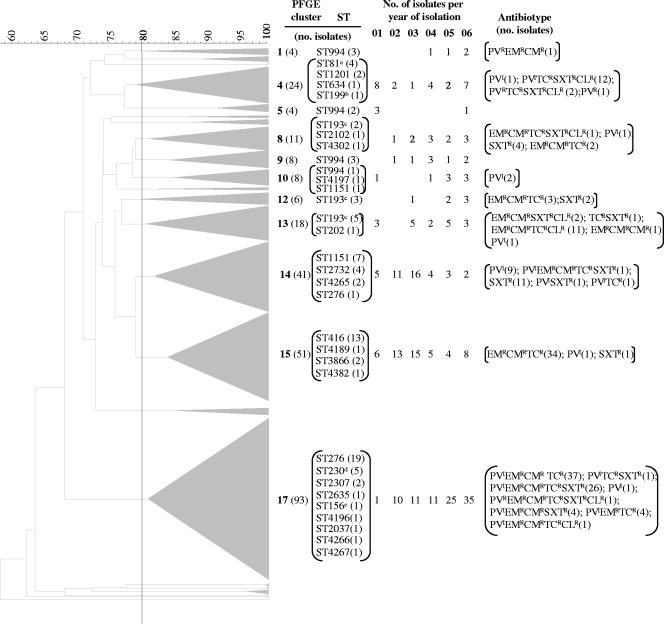
FIG. 1.
Macrorestriction dendrograms and ST information for serotype 19A isolates. Dice coefficient values (percentages) are indicated in the scale above the dendrogram. Whenever two or more isolates had a macrorestriction pattern with a Dice coefficient of ≥80%, a triangle proportional to the number of isolates is indicated in the dendrogram. The number in boldface type beside each triangle indicates the PFGE cluster number, and the number in parentheses indicates the number of isolates grouped in that cluster. All STs determined for isolates of each PFGE cluster are indicated, and the number in parentheses indicates the number of isolates exhibiting that ST. The distribution of the isolates found in each PFGE cluster (n ≥ 4) over the years of the study is presented. The superscript letters identify STs identifying clones spread internationally, as follows: a, Spain23F-ST81; b, Netherlands15B-ST199; c, Greece21-ST193; d, Denmark14-ST230; e, Spain9V-ST156. Nonsusceptibility to various antimicrobial agents is indicated by superscripts, as follows: R, resistant; I, intermediate; CL, chloramphenicol; CM, clindamycin; EM, erythromycin; PV, penicillin; SXT, co-trimoxazole; TC, tetracycline. The number of isolates sharing the same antimicrobial resistance profile is indicated in parentheses.

