FIG. 4.
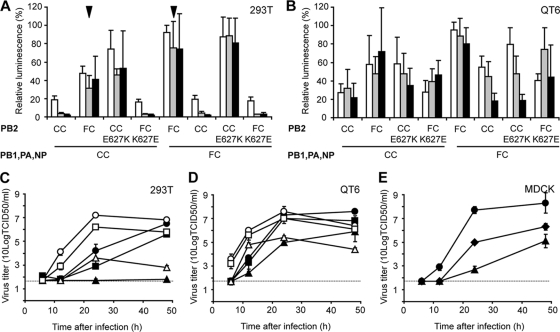
Polymerase activities and replication kinetics of H7N7 viruses. (A and B) Minigenome assays were performed by transfecting 293T (A) or QT6 (B) cells with plasmids encoding the polymerase proteins and NP of the CC and FC viruses or mutants thereof. After transfection, cells were incubated 24 h at 33°C (white bars), 37°C (gray bars), or 41°C (black bars). Luminescence of a firefly luciferase reporter was standardized using a plasmid constitutively expressing Renilla luciferase protein. Relative luminescence was calculated as the percentage relative light units (firefly luciferase/Renilla luciferase) of the maximum in each experiment. Averages and standard deviations from three independent experiments are shown. Arrowheads indicate the effect of PA on polymerase activity in the context of the FC virus PB2, as explained in the text. (C to E) Replication kinetics were determined by infecting 293T (C), QT6 (D), or MDCK (E) cells at an MOI of 0.01 TCID50/cell with the CC (triangles), FC (circles), and CC-FC PB2 (squares in panels C and D) or CC-FC PA (diamonds in panel E) virus. Supernatants were collected at 6, 12, 24, and 48 h after inoculation and titrated by end point dilution in MDCK cells. Filled symbols, 37°C; open symbols, 33°C. Geometric mean titers were calculated from two independent experiments; the cutoff value was used for negative samples. Error bars indicate standard deviations. The cutoff value of the virus titration assay is indicated by a dotted line. The replication kinetics shown for the CC and FC viruses in QT6 and MDCK cells are identical to those shown in Fig. 1.

