FIG. 3.
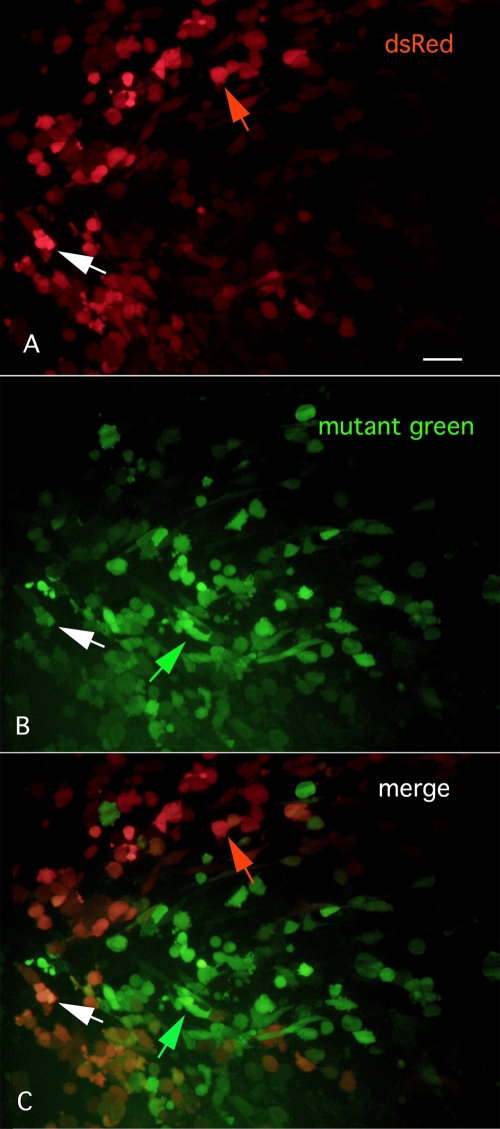
Selective expression of green or red fluorescence. (A) With 535-nm excitation, infected cells show a red fluorescence. Bar, 30 μm. (B) In the same field, other cells show little red fluorescence but show selective green fluorescence with 488-nm excitation. (C) The merged image combining panels A and B above shows red or green cells.

