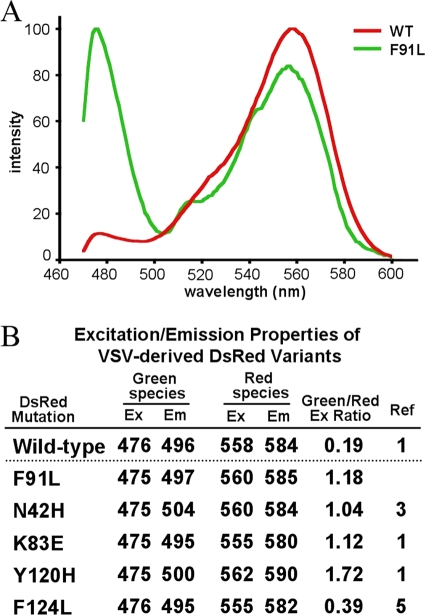
FIG. 4.
(A) Excitation scans of VSV plaques expressing F91L (green) and wild-type (WT; red) DsRed. Intensity values are normalized across the spectral range. (B) Maximum excitation (Ex) and emission (Em) (nm) from the mutant plaques that we isolated. The ratios (column 5) are the green excitation peaks divided by the red excitation peaks.

