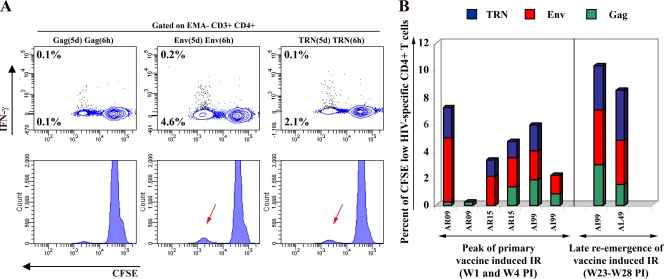
FIG. 6.
HIV-specific CD4+ T-cell responses in immunized macaques. For all five vaccinated macaques, PBMCs were processed and labeled at the peak (between 2 and 4 weeks following immunization) and late reemergence (between 23 and 28 weeks following immunization) phases of vaccine-induced IR using the procedure described in the legend to Fig. 2. (A) Flow cytometry data analyses were performed by gating on a low-FSC/SSC, EMA−, CD3+, and high CD4+ T-cell population (colored in blue). Representative results for macaque AR09 at the peak of the IR are displayed. The proportion of cells producing IFN-γ (contour plot, upper number) and proliferating (CFSE dilution; contour plot, lower number) in response to Gag, Env, and TRN peptides are indicated. (B) Summary of the frequency of proliferating-only (CFSE low) Gag (green bar)-, Env (red)-, and TRN (blue)-specific CD4+ T cells detected in samples from each immunized animal.

