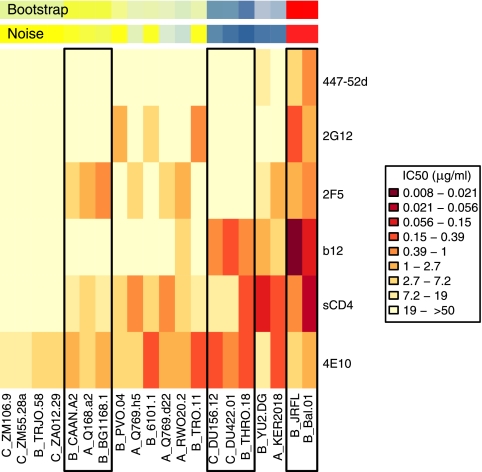
FIG. 3.
Heat map and clustering analysis of monoclonal antibodies and sCD4. Each row of the heat map shows IC50 values for a single reagent, and columns show virus isolates. See legend to Fig. 2 for an explanation. Boxes show isolates assigned to clusters at the 75% level. Neutralization data are from references 16 and 17 and this study.

