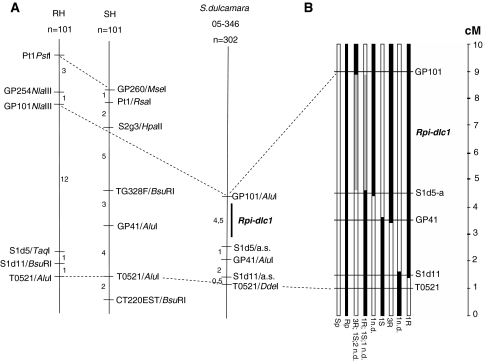
Fig. 2.
a Maps of chromosome 9 of potato (RH × SH) and S. dulcamara near the Rpi-dlc1 locus. Numbers indicate genetic distances in cM between markers. b Schematic representation of the genomic region in the population 05-346 containing Rpi-dlc1. Black bars represent resistant, white bars susceptible marker profiles and gray bars indicate the genomic region where Rpi-dlc1 was mapped. At the bottom end of the bars results from the field experiment are presented. Numbers indicate number of offspring with clear phenotype, R is resistant, S susceptible and n.d. not determined phenotype. Rp and Sp are the resistant and susceptible parents, respectively. Genetic distances between markers GP101 and T0521 were calculated for 302 individuals. Among these, 23 recombinants were found. Genetic distances for the remaining three polymorphic markers S1d5-a, GP41 and S1d11 were calculated using 210 individuals and 16 recombinants that were tested in the field. On the right a cM scale

