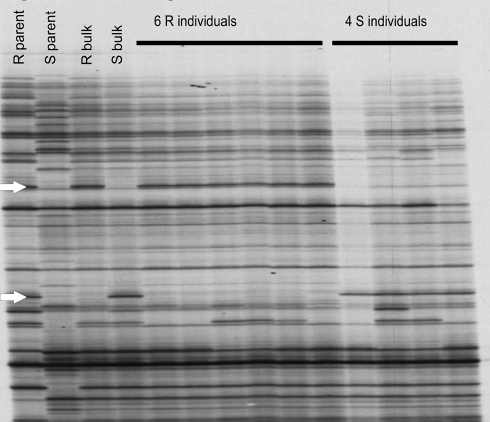
Fig. 1.
An example of a part of a NBS profiling gel. This figure shows part of the NBS profiling gel of population snk7458 using NBS2 and MseI. The arrows indicate the segregating NBS profiling bands. The upper arrow points at a band in coupling phase, the lower arrow points at a band in repulsion phase

