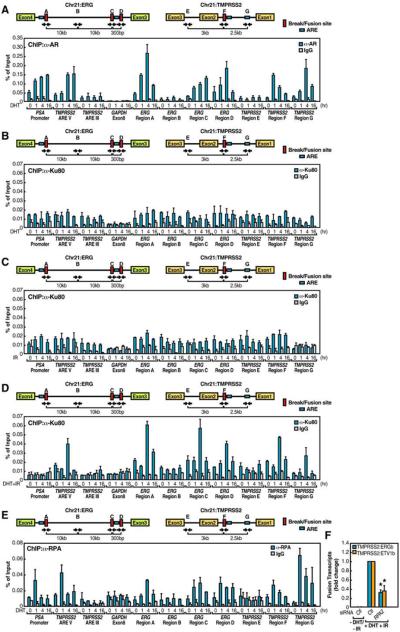
Figure 4. AR-Dependent Local Chromatin Structural Alteration Sensitizes to Site-Specific Genotoxic Stress-Induced DSBs.
(A-E) Top: schematic diagram showing the relative positions of break/fusion sites and potential AREs located on ERG and TMPRSS2 loci. Blue boxes, potential AREs; red boxes, break/fusion sites; black arrows, relative positions of PCR primers. Bottom: LNCaP cells were treated with DHT (10−7 M) (A), DHT (10−7 M) (B), IR (50 Gy) (C) or both (D) and DHT (10−7 M) (E) for time courses as indicated. ChIP analyses were performed with indicated antibodies on indicated regions (n=2, ±SEM). (F) Examination of TMPRSS2:ERGb and TMPRSS2:ETV1b fusion transcripts with RPA2 siRNAs (n=3, ±SEM).

