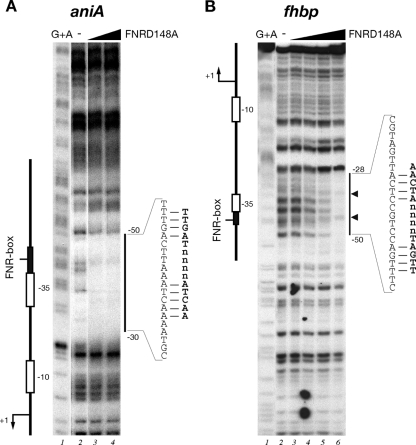
FIG. 4.
Footprinting analysis of purified FNR(D148A) on the aniA (A) and fhbp (B) intergenic probes. The probes were labeled at one end and prepared as described in Materials and Methods. Lane 1 is a G+A sequence reaction obtained with each probe and used as a molecular weight marker. Footprinting reactions containing purified FNR(D148A) protein at final concentrations of 0 nM, 13 nM, and 40 nM in panel A (lanes 2 to 4, respectively) and at 0 nM, 8 nM, 40 nM, 200 nM, and 1 μM in panel B (lanes 2 to 6, respectively). The vertical bar on the right side of each panel indicates the area of DNase I protection in the promoter region; small arrows refer to DNase I hypersensitive sites. The numbers indicate the positions of the relevant nucleotides with respect to the +1 transcriptional start site. The nucleotides corresponding to the FNR binding site are indicated, with mismatches to the FNR box of E. coli displayed on the right.

