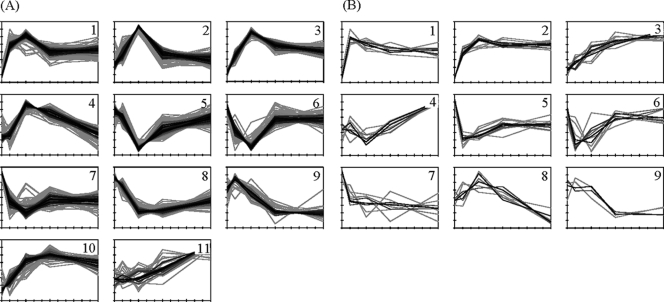
FIG. 2.
Results of the K-medians clustering of the transcriptomic (A) and proteomic (B) expression profiles. The cytosolic and the membrane proteomes were clustered together. The expression profiles are color-coded, corresponding to their similarity (correlation coefficient) to the cluster median. The KMC results as well as the respective functional analysis data are available in files S4A and S4B in the supplemental material.

