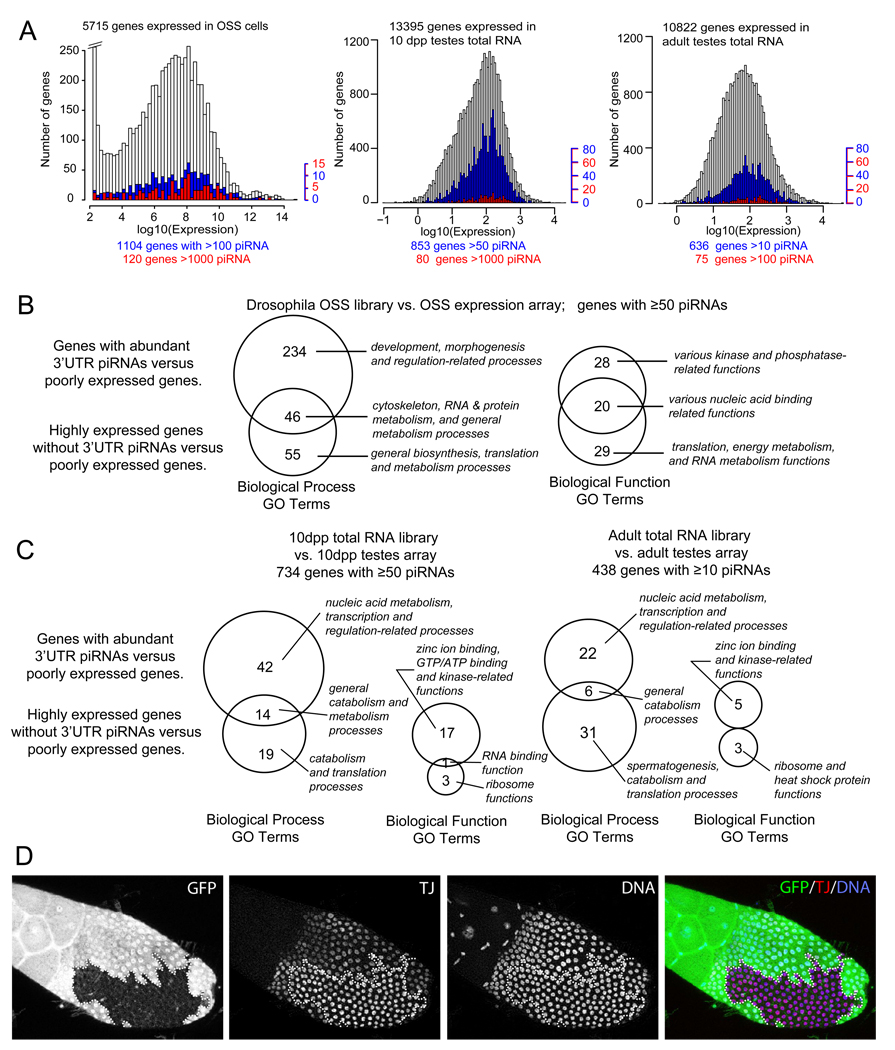
Figure 5.
(A) Histograms of genes by their ranked log10 expression levels and their corresponding count of 3’ UTR piRNAs from OSS cells, mouse 10dpp testes total RNA, and mouse adult testes total RNA libraries. Expressed genes are represented in white bars, genes with noted cutoff of piRNAs are in blue or red bars. (B) Venn diagrams showing the comparison of GO term enrichments in mRNAs with abundant 3' UTR-directed piRNAs from OSS cells. Shown are counts of GO terms enriched amongst mRNAs with abundant (>1000 reads) and preferred production of piRNAs from 3' UTRs. Call-out labels highlight notable GO terms with the strong statistical significance (p<10−4). (C) Venn diagrams comparing GO term enrichments between mRNAs with abundant 3’ UTR-directed piRNAs and highly expressed mRNAs lacking 3’ UTR piRNAs in mouse 10dpp and adult testes. Details of the GO analyses, including of piRNA-producing transcripts lacking preferred 3' UTR enrichment, are available in Supplementary Tables S6A–B (fly) and S7 (mouse). (D) Staining of piwi mutant follicle clones with GFP antibody (green, to identify clone borders), Tj antibody (red) and DAPI (blue, to identify nuclei). Homozygous piwi mutant clones, as marked by absence of GFP, exhibit elevated levels of Tj.

