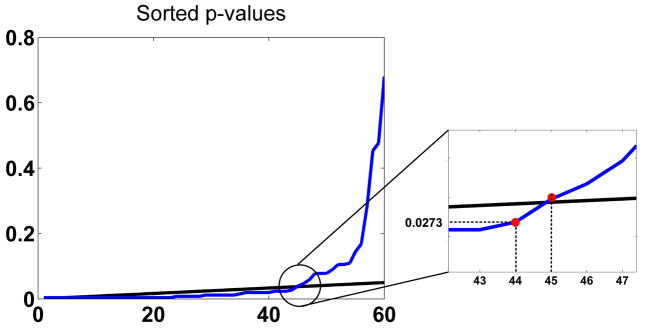
Fig. 10.
FDR procedure for the p-values of the SSTF statistics. The blue line sorts the 60 p-values of Table 1 in ascending order. The black line is the 0.05 significance line for 60 hypothesis tests. Based on FDR theory, all p-values below the highest crossing point, i.e. p ≤ 0.0273, are significant.

