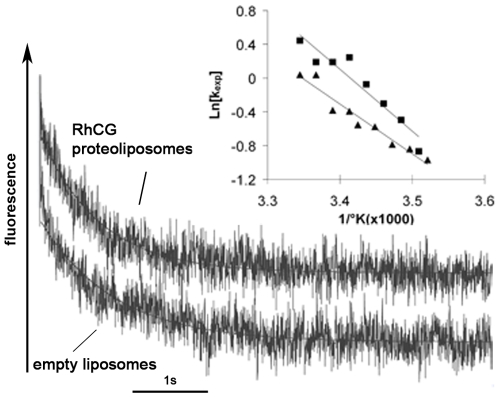
Figure 6. Stopped-flow analysis of water osmotic variations in liposomes and RhCG-proteoliposomes.
Individual time courses of fluorescence quenching in RhCG-proteoliposomes were obtained at 20°C with empty liposomes and RhCG-proteoliposomes submitted to a 50 mosmol/kg H2O osmotic gradient. Inserts represents the Arrhenius plots of temperature-dependent water permeation allowing the determination of activation energy (Ea) values from the slopes.

