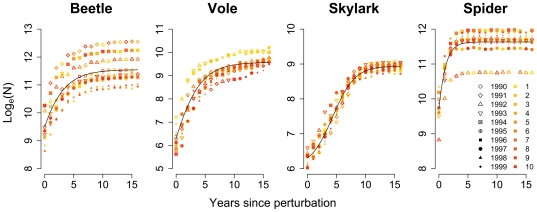
Figure 2. Population growth in the original 10×10-km landscape after 95% reductions in population size.
Perturbations occurred every 17 years, and points have different colors depending on how many times perturbations had occurred. Weather years (i.e. the year that the weather data originated from) are indicated with different symbols. Curves were fitted using a three-parameter logistic model (four-parameter for skylark).

