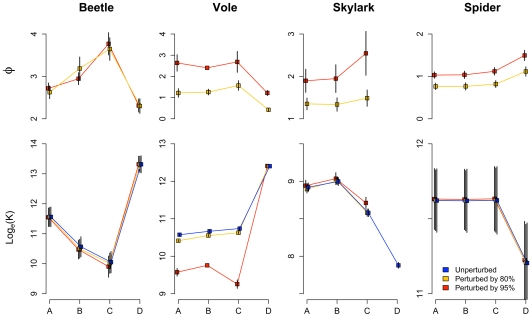
Figure 3. Return times (φ) and equilibrium population sizes (K) in four successively simplified landscapes, fitted as in Fig. 2.
A–D are as in Fig. 1, with A being the original and most complex landscape. Colors indicate perturbation intensity. Error bars are 95% confidence intervals corresponding to variation among weather years. For vole perturbed by 95% no confidence intervals could be calculated in landscape B as the mixed model did not converge. No return times were calculated for unperturbed populations. For skylark the population did not increase logistically in landscape D so K and φ could not be calculated.

