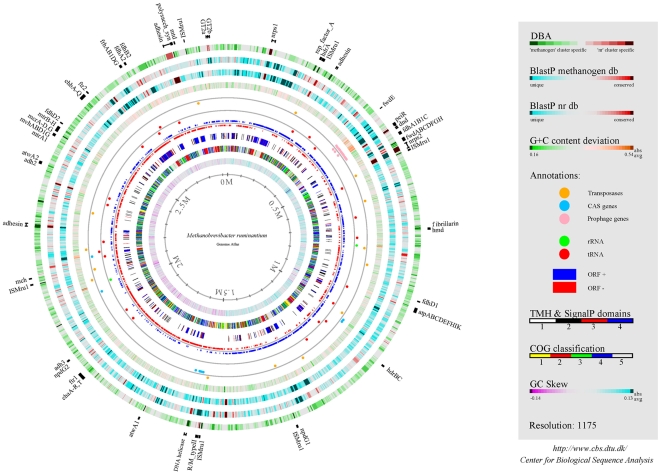
Figure 1. Genome atlas of M1.
Single circles in the top-down- outermost-innermost direction are described. Outermost 1st ring: DBA between the nr database (Ring 3) and dbMethano, a custom methanogen database (Ring 2). Regions in green indicate protein sequences highly conserved between M1 and methanogens but not found in the nr database beyond methanogen genomes. Regions in red indicate protein sequences conserved between M1 and the nr database but not present in other methanogen genomes. 2nd ring: gapped BlastP results using dbMethano. 3rd ring: gapped BlastP results using the nr database minus published methanogen genome sequences. In both rings, regions in blue represent unique proteins in M1, whereas highly conserved features are shown in red. The degree of colour saturation corresponds to the level of similarity. 4th ring: G+C content deviation: green shading highlights low-GC regions, orange shading high-GC islands. Annotation rings 5 and 6 indicate absolute position of functional features as indicated. 7th ring: ORF orientation. ORFs in sense orientation (ORF+) are shown in blue; ORFs oriented in antisense direction (ORF-) are shown in red. 8th ring: prediction of membrane bound and cell surface proteins. White: no transmembrane helices (TMH) were identified, Black: ORFs with at least one TMH, Red: ORFs predicted to encompass a signal peptide sequence and Blue: ORFs predicted to incorporate both TMH and a signal peptide sequence. 9th ring: COG classification. COG families were assembled into 5 major groups: information storage and processing (yellow); cellular processes and signalling (red); metabolism (green); poorly characterized (blue); and ORFs with uncharacterized COGs or no COG assignment (grey). 10th ring: GC-skew. Innermost ring: genome size (Mb). Selected features representing single ORFs are shown outside of circle 1 with bars indicating their absolute size.

